What the Demo does
What’s Produced
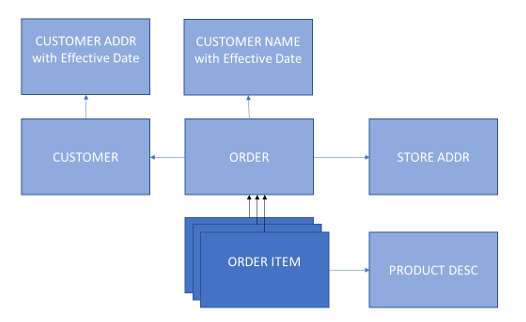
This demo contains dummy data generated by a program. It has several large order item files, and separate reference files for orders, products, stores and customers. By looking at the data names, you can guess what kind of data they contain.
GenevaERS Demo Data Diagram

This demo creates these reports:
- All orders including customer and product details, output to a combination of files DD Names OUTPUT01, 2 and 3 in the RUNEXT1 job.
- A summary of all orders by customer, output to DD Name DCUSTORO in the RUNFMT1 job.
- A summary of all orders by customer, and by store location output to DD Name DCOBYSTO in the RUNFMT2 job.
- A summary of products sold, by store location, output to the DD Name DAGSTATO in the RUNFMT3 job.
It creates the reports by reading all the data only once (rather than each report re-reading all the data). This is why GenevaERS is called the “Single-Pass Optimization Engine” - all input data is read only once.
How It Works
Users tell GenevaERS what to do in a “view” which essentially describes inputs, processing, and outputs. Each report is specified in a view, for example. Sometimes there are intermediate views that collect data and process data and present it to the later view for further processing. GenevaERS processes each view in the Performance Engine, which can be described as a data scan engine.
The Performance Engine analyzes the views, generates the most efficient machine instructions to read the source data only once, optimizes the joins to additional data sources and runs multiple threads to scan the data in parallel.
The demo produces output using these views::
-
10689 Extract With Lookups View - Create an order list that includes Store and Customer information and write output data into three files (one file per store)
-
10700 Extract Order Item Order View - Perform intermediate data transformations and store output data in memory
-
10702 Summary Customer Order Sales View - Generate a summarized order report by reading data created by a view 10700
-
10714 Summary Customer Order By State Sales View - Generate a summarized customer report by reading data created by view 10700
-
10715 Summary Product Qty Sold By State View - Create summarized product quantity report
Each view has a unique ID. A view has a data source, a list of output fields and an output format, and specifies how to select input records (for example orders at a location during a time period), and how to select output records (for example ignoring zero cases).
A view can specify additional data joins (such as using a product code to find product details in a product file). A view can also specify calculations to achieve the required output (for example currency conversion).
A view hence describes the inputs and how to achieve the outputs.
GenevaERS Demo View Flow

These views read data from five source files (three order items, an order, and a customer file). Each view creates an output.
Note view number 10700 is an intermediate processing view producing a virtual file (never written to disk) feeding data to views 10702 and 10714.
Let’s examine the EXTRRPT, the Performance Engine Execution Summary report, produced in the submitted RUNEXT1 job:
Views processed:                5
Parallel threads executed:      5
Lookup steps performed:         89,317,465

Source files read:              5
Source records read:            140,922,959
Source bytes read:              1,487,800,938

Output files written:           5
Output records written:         4,308,570
Output bytes written:           799,657,615

Elapsed time (HHHH:MM:SS.hh):   0:00:23.09
Elapsed time (seconds):         23.09
As you can see a Performance Engine executed five threads to read the 140,922,959 records from the source files in parallel. It wrote 4,308,570 output records into five files but read the source data only once. It also performed 89,317,465 joins.
All the data scan requests are completed in 23.09 seconds.
After running demo you can do more with After the demo.